


Ethereum price today: $3,370
Short-term Ethereum holders have engaged in panic selling, with some experiencing realized losses of more than $60 million. The silence of long-term holders and the sharp decline in foreign exchange reserves indicate that the price decline may be temporary. ETH could fall to $3,000 on a psychological level after validating the double top pattern on the daily timeframe.
Ethereum (ETH) fell below a key support level at $3,550 on Thursday following bearish pressure from the Federal Reserve’s decision to cut interest rates. However, on-chain analysis shows that long-term holders have remained silent despite the bearish sentiment, and the price decline may not last long.
Ethereum’s on-chain indicators indicate price drop may be temporary
Ethereum has fallen more than 10% over the past four days and is on track to record its worst weekly performance since the last week of July.
Despite cutting rates by 25 basis points on Wednesday, the decline accelerated after the Fed adjusted its outlook for 2025 rate cuts from four to two.
The impact on ETH has been horrendous compared to most other crypto assets in the top 10, wiping out recent gains against Bitcoin and Solana.
Dormant coin circulation metrics indicate that most of the recent sales activity is from investors who have purchased ETH within the past year or short-term It indicates that it is by the holder (STH).
%20(20.42.48,%2019%20Dec,%202024)-638702376627061585.png)
ETH Dormant Coin Distribution (STH) | Santiment
ETH’s network realized P&L reveals that most of these STHs have been sold at a loss, with realized losses exceeding $60 million in the past two days.
However, long-term holders (LTH) remain faced with the recent price decline, as reflected in the downtrend in the chart below. In contrast to panic selling during price declines, LTH has been able to partially capitalize on ETH’s notable gains over the past few months.
%20(20.42.53,%2019%20Dec,%202024)-638702377164969148.png)
ETH dormant coin circulation (LTH) | Santiment
Since LTH has not been included in any recent selling activity, the decline may not last long as historically prices tend to recover quickly on such occasions. Therefore, it will be important to keep an eye on their behavior in the coming days. If they fail to join the selling train, the recovery could happen quickly.
Furthermore, Ethereum’s foreign exchange reserves have fallen sharply over the past three days, indicating that investors are buying on the edge.
-638702377679687647.png)
Ethereum Exchange | CryptoQuant
A similar trend can be seen in ETH exchange netflow, with data from Coinglass showing an increase in withdrawals on exchanges such as Binance, OKX, Bybit, Kraken, and Bitstamp. .
Meanwhile, the Ethereum ETF saw net inflows of $2.5 million on Wednesday, extending its streak of consecutive inflows to 18 consecutive days.
Ethereum price prediction: ETH could fall to $3,000 after double top verification
Ethereum continued to liquidate more than $220 million worth of liquidations in the past 24 hours, with liquidated long positions accounting for nearly $200 million, according to data from Coinglass.
ETH experienced a significant drop in volume and fell below the $3,550 support level as market participants were still reacting to the Fed’s hawkish interest rate cut decision heading into 2025.
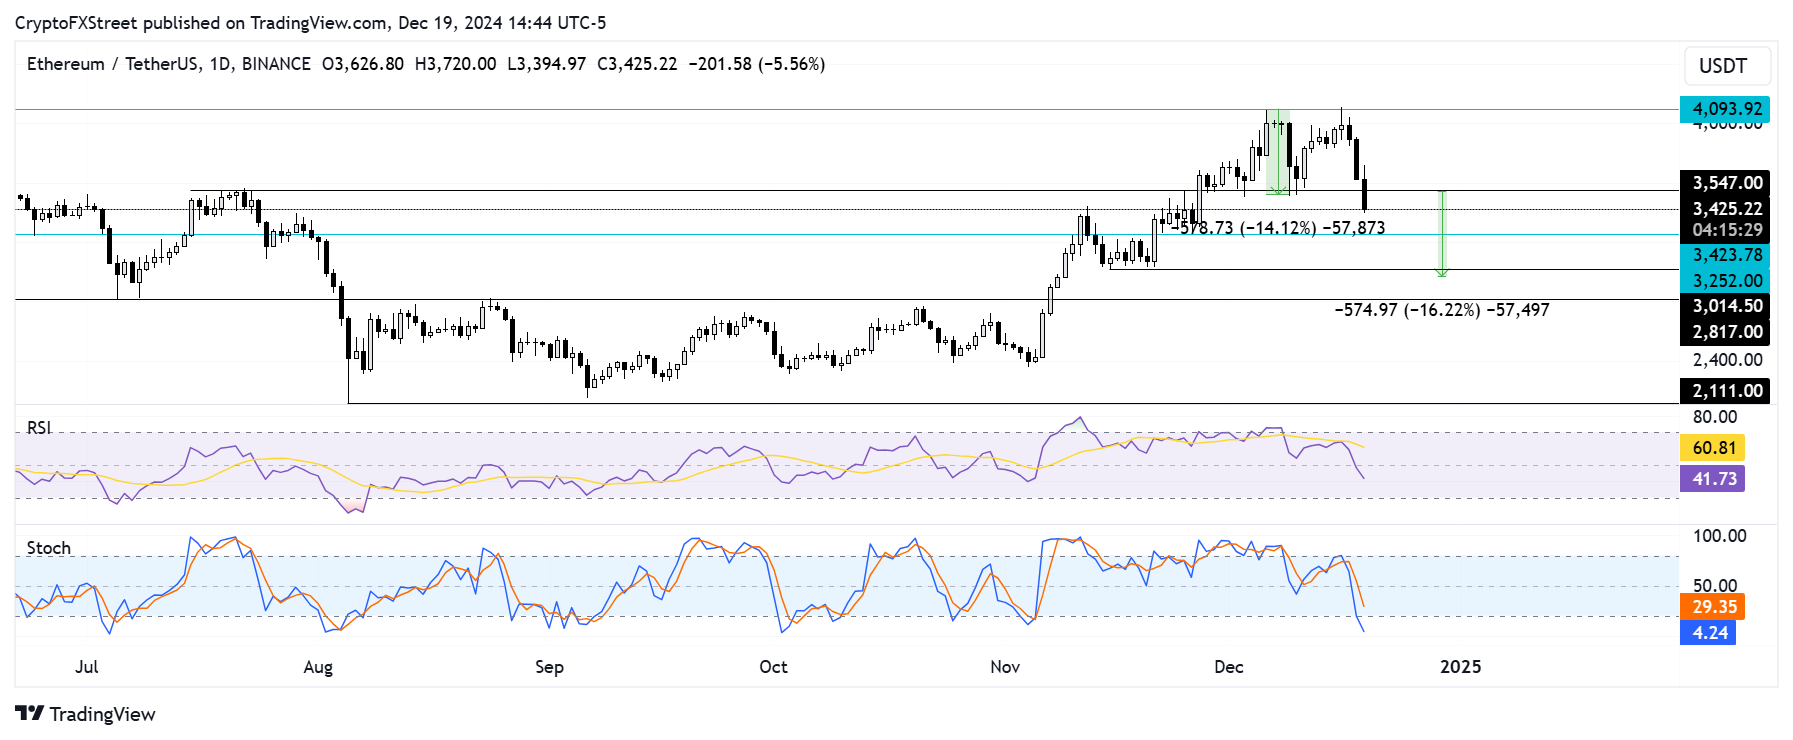
ETH/USDT daily chart
This decline confirms the double top pattern that ETH has formed within the past two weeks.
After seeing a rejection near the year-to-date high resistance of $4,093 on December 6th, ETH fell to the neckline support level near $3,550 and formed a bottom. ETH rebounded from $3,550 and briefly rebounded before rebounding again at $4,093.
Recent volume has been a significant drop below neckline support at $3,550, and if buyers are unable to outpace sellers, ETH could continue to fall towards support near the psychological level of $3,000. There is sex. This objective is obtained by measuring the height of the decline from the price peak to the neckline.
However, the $3,250 support level could help prevent such a decline.
The Relative Strength Index (RSI) has fallen below the neutral level, indicating growing bearish momentum.
In particular, the RSI on the daily chart shows that ETH tends to continue to fall when a negative reaction is seen near the yellow moving average line.
Meanwhile, the stochastic oscillator (Stoch) has entered oversold territory, indicating that the price may recover soon from the recent decline.
If the daily candlestick close price exceeds $3,550, the theory is invalidated.